

A key point to bear in mind with respect to the outlook for oil prices going forward is that the powers that be intend to bankrupt the population at large and reduce them to a state of dependency in order to force them into the Universal Basic Income (UBI) and have already said so (“You will own nothing and be happy”) and a key plank to achieving this will be making the prices of the basics of life exorbitantly expensive.
A high oil price makes everything more expensive since oil is generally used to create and distribute food and products. Even if demand collapses, it will be possible to maintain high oil prices by engineering supply chain problems that may include sabotage and the effects of war.
The entire commodity sector looks set to rally, not least oil, in which case, emboldened by having just made new highs, it may simply continue to advance and may even accelerate. Its moving averages are in strongly bullish alignment, which helps.
Anticipation of higher oil prices may explain why the prices of oil stocks are running ahead of oil prices as we will now proceed to see as we review the charts.
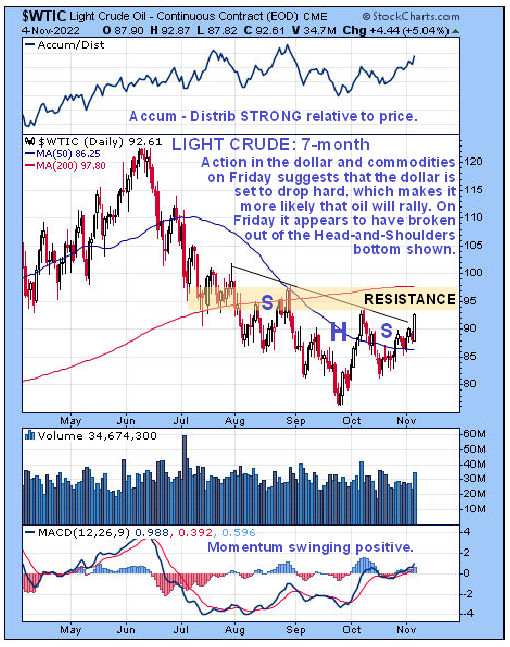
In the last Oil Market update posted toward the end of August, we were prematurely bullish on oil, as it went on to drop further to hit bottom a month later towards the end of September, the decline being largely due to the strong dollar as was the case with many other commodities.
What was taken to be a breakout from a downtrend turned out to be the right side of the Left Shoulder of the now completed Head-and-Shoulders bottom that is shown on the latest 7-month chart for Light Crude below.
At the time, I was fooled by the strong Accumulation line, but as it turns out, it was just starting the basing process. In any event, oil’s chart now looks most promising, especially as other commodities such as copper, palladium, and Precious Metals appear to be breaking out at this time as the dollar looks increasingly vulnerable to a severe decline.
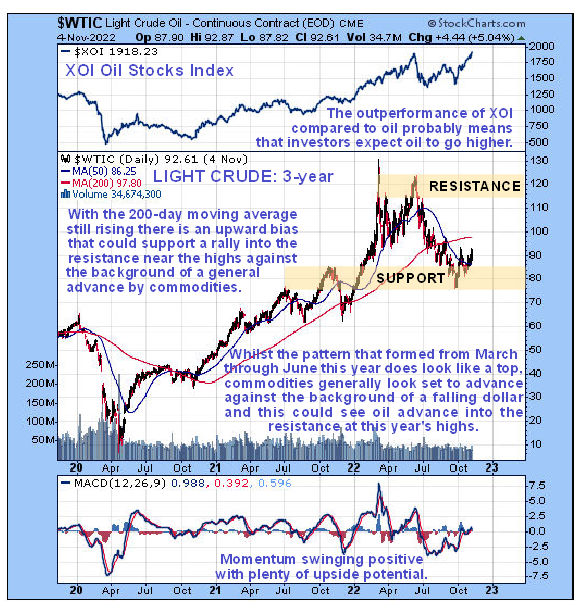
On the 3-year chart for Light Crude, it is immediately clear why the oil price corrected through the Summer – it had gotten ahead of itself with a dramatic spike to become extremely overbought early in the year.
Whilst the pattern that formed from March through June could mark a final high, a Double Top, that is not thought likely because of the way most commodities appear to be setting up for a major rally in the facing of rapidly mounting inflation, and also, as mentioned at the outset, because the powers that be want a high price to further their nefarious purposes, which they also happen to benefit from as they are the major stakeholders in the oil sector.
Overall this chart still looks positive, with oil having reacted back to a key support level where it appears to be turning up with momentum (MACD) swinging positive, suggesting renewed advance, and the oil stocks index, shown at the top of this chart, already starting to make new highs which is a sign that they are expecting higher oil prices. If we do see renewed advance soon, the moving averages will quickly swing back into strongly bullish alignment.
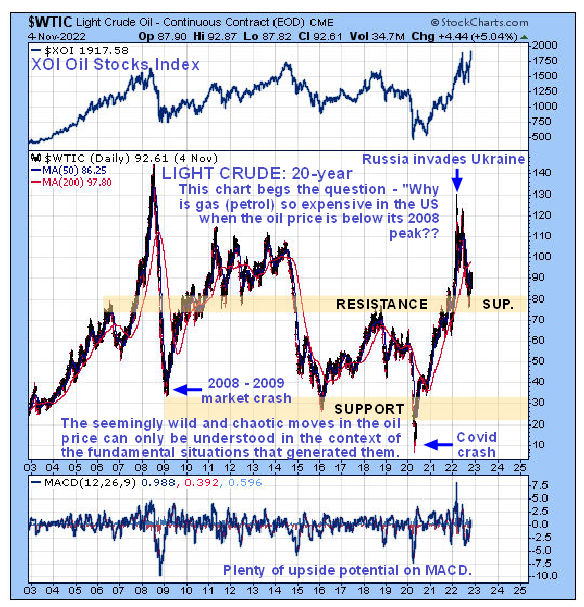
The moves shown on the long-term 20-year chart for Light Crude, at first sight, look random and chaotic, and they can only be understood in the context of the fundamental situations that generated them.
Commodities are looking set to take off higher as the dollar drops.
Thus, the plunge in 2008 – 2009 was directly attributable to the general market crash at that time, while the absurd lows of Spring 2020 were the result of Covid, and oil spiked early this year around the time of the Russian invasion of Ukraine.
The recent reaction has brought it back to the zone of significant support shown above the 2019 highs, which is turning it higher again.
As mentioned above, the positive divergence of oil stocks, whose index is shown at the top of this chart, strongly suggests a rising oil price going forward as oil stocks tend to lead oil itself and the position of the MACD indicator, which is closet to neutrality, shows that there is plenty of scope for a rally.
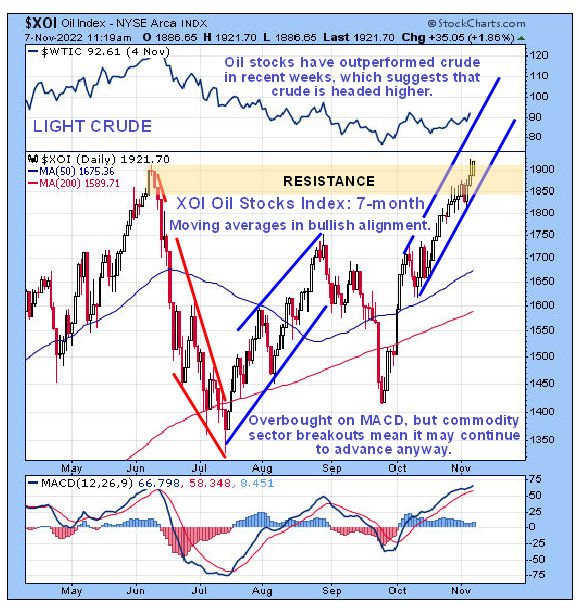
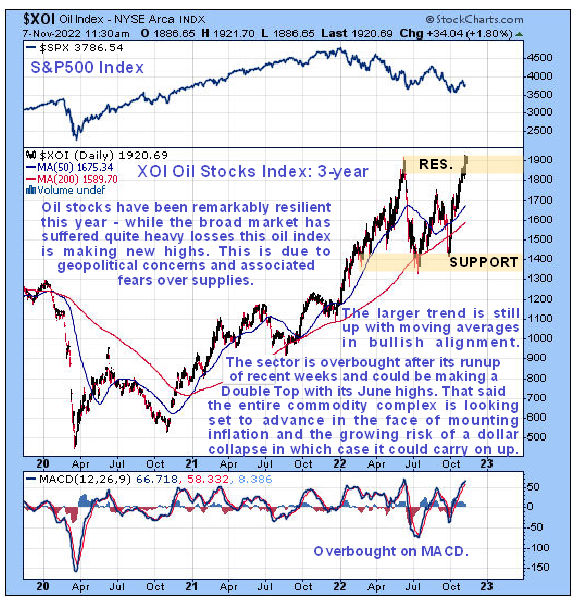
Turning now to the oil stocks, we see on the 7-month chart for the XOI oil index that it has been gyrating around rather wildly this year and has advanced strongly over the past six weeks or so, way outperforming oil itself, so that it is now overbought on its MACD indicator.
However, this may not stop it because the entire commodity sector looks set to rally, not least oil, in which case, emboldened by having just made new highs, it may simply continue to advance and may even accelerate. Its moving averages are in strongly bullish alignment, which helps.
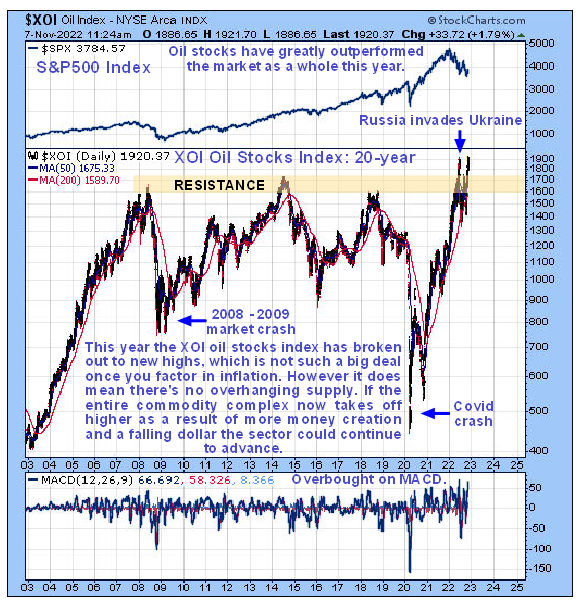
On the 3-year chart for the XOI index, we can see that the oil sector has way outperformed the broad stock market this year — the S&P500 index is shown at the top of this chart — with the broad market putting in a dismal performance while oil stocks are now nudging new highs.
Whilst the oil index is now overbought, and thus in some danger of forming a Double Top with its June highs, this is not considered likely to the reasons already given, namely that commodities are looking set to take off higher as the dollar drops.
Instead, it looks set to advance to clear new highs and then continue to ascend for a while before a correction perhaps sets in.
The long-term 20-year chart for the XOI oil index is interesting as it shows that it has this year broken above a line of tops extending back to 2008.
Whilst the break to new highs is still not yet by a convincing margin, which means that it could slump back into the larger pattern, the outlook for the commodities sector here and the associated outlook for the dollar and for inflation implies that the sector could soon break higher and advance away from all those previous tops, which is not so surprising when you take into account that if you factor in inflation even if only up to now, it would have to rise quite a long way above its 2008 highs to attain the same inflation-adjusted value.
Want to be the first to know about interesting Oil & Gas - Exploration & Production and Oil & Gas - Services investment ideas? Sign up to receive the FREE Streetwise Reports' newsletter.
Subscribe
CliveMaund.com Disclosures
The above represents the opinion and analysis of Mr. Maund, based on data available to him, at the time of writing. Mr. Maund's opinions are his own, and are not a recommendation or an offer to buy or sell securities. Mr. Maund is an independent analyst who receives no compensation of any kind from any groups, individuals or corporations mentioned in his reports. As trading and investing in any financial markets may involve serious risk of loss, Mr. Maund recommends that you consult with a qualified investment advisor, one licensed by appropriate regulatory agencies in your legal jurisdiction and do your own due diligence and research when making any kind of a transaction with financial ramifications. Although a qualified and experienced stock market analyst, Clive Maund is not a Registered Securities Advisor. Therefore Mr. Maund's opinions on the market and stocks can only be construed as a solicitation to buy and sell securities when they are subject to the prior approval and endorsement of a Registered Securities Advisor operating in accordance with the appropriate regulations in your area of jurisdiction.
Disclosures:
1) Statements and opinions expressed are the opinions of Clive Maund and not of Streetwise Reports or its officers. The author is wholly responsible for the validity of the statements. Streetwise Reports was not involved in any aspect of the article preparation. The author was not paid by Streetwise Reports LLC for this article. Streetwise Reports was not paid by the author to publish or syndicate this article.
2) This article does not constitute investment advice. Each reader is encouraged to consult with his or her individual financial professional and any action a reader takes as a result of information presented here is his or her own responsibility. By opening this page, each reader accepts and agrees to Streetwise Reports' terms of use and full legal disclaimer. This article is not a solicitation for investment. Streetwise Reports does not render general or specific investment advice and the information on Streetwise Reports should not be considered a recommendation to buy or sell any security. Streetwise Reports does not endorse or recommend the business, products, services or securities of any company mentioned on Streetwise Reports.
3) From time to time, Streetwise Reports LLC and its directors, officers, employees or members of their families, as well as persons interviewed for articles and interviews on the site, may have a long or short position in securities mentioned. Directors, officers, employees or members of their immediate families are prohibited from making purchases and/or sales of those securities in the open market or otherwise from the time of the decision to publish an article until three business days after the publication of the article. The foregoing prohibition does not apply to articles that in substance only restate previously published company releases.


