


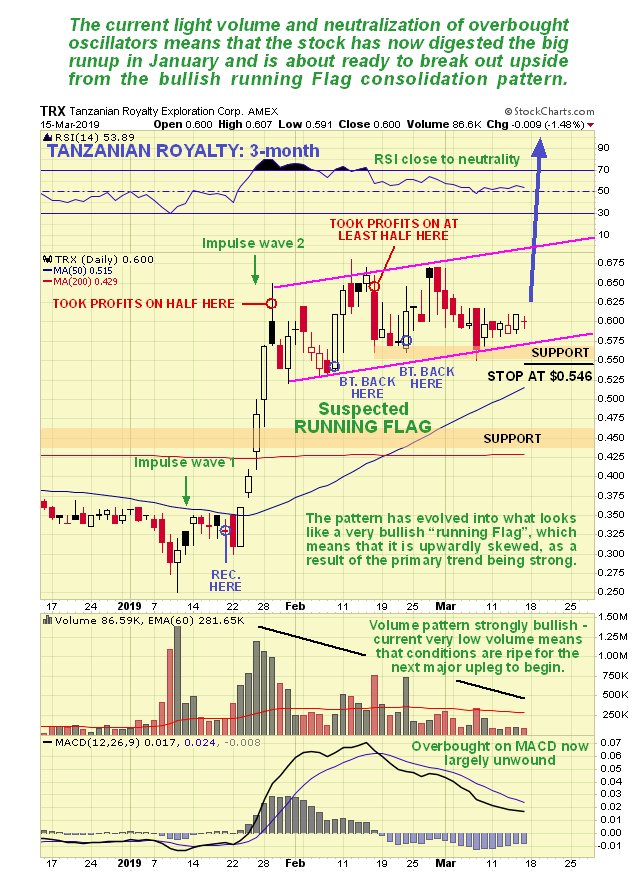
Tanzanian Royalty Exploration Corp. (TNX:TSX; TRX:NYSE.MKT) is a good performer technically and we have traded it well, buying it on the 20th January, scaling back positions when it got very overbought on 29th January, bought back what we'd sold at a better price on the 8th February, scaled back positions again on the 15th Feb. after another rally, and bought it back after another dip on 22nd Feb. as you will see on its latest 3-month chart shown below. We could have done what we did on two prior occasions and sold some at the late February peak and bought back on the dip to the lower boundary of the range about a week ago, but we never got round to it, and also because there is an increasing risk that such aggressive trading will result in missing "The Big One," which is where it breaks out of the top of the pattern to commence its next upleg.
Speaking of upside breakouts, Tanzanian Royalty now looks about ready to break out of this trading range and embark on the next upleg, which is likely to be big and could be huge if the deep drill rig now working its way through the planned open pit at Buckreef to probe what lies beneath strikes it richif it does we could be looking at a world-class gold mine here, and at a time when the long sector malaise is coming to an end. The technical chart setup looks very positive indeed as we can see on the range of charts presented below. The upward skew of the current trading range makes it a very bullish "Running Flag," an interpretation that is supported by the now strongly bullish volume pattern, with volume having ebbed away to a low level as the Flag pattern approaches completion. The duration of this Flag has allowed the overbought condition of various oscillators resulting from the spike higher in January (which we rode) to almost fully unwind, and the rising 50-day moving average to almost catch up with the price, which means that the stock is "gassed up" for the next run.
The 6-month chart allows us to view a less cluttered picture over a timeframe twice as long, and enables us to look at additional indicators like the Accumulation line and On-balance Volume line added to this chart. They look OK with the latter indicator being the strongest of the two.
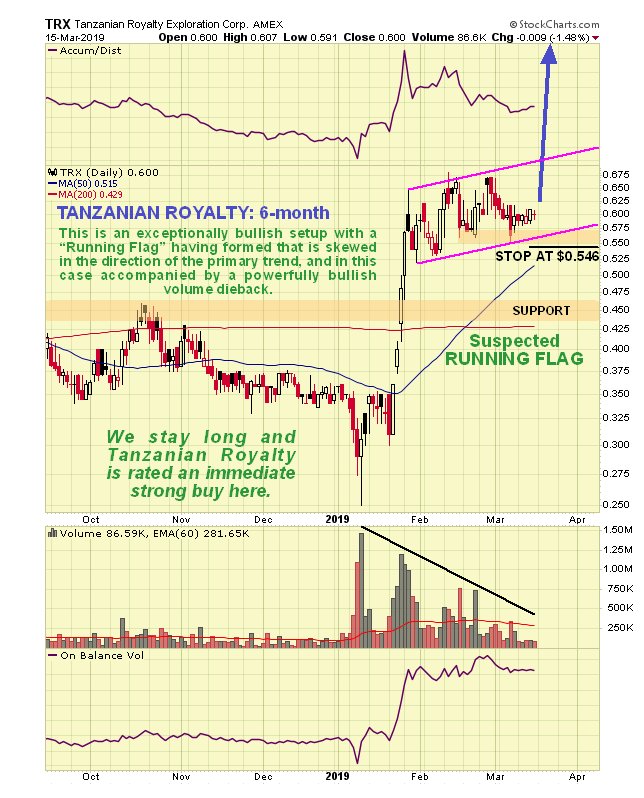
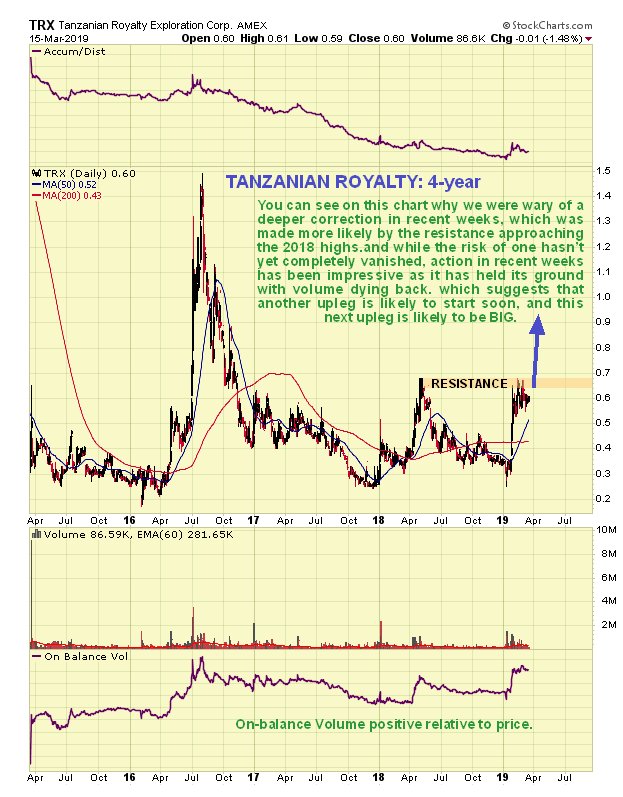
On the 4-year chart we gain a broader perspective and you can see why we were wary of a deeper correction in recent weeksthe strong upleg in January stalled out exactly where one would expect, at the resistance at the 2018 highs, which is why we sold almost half of our position very close to the top. Clearly there was a risk of a deeper reaction than we have seen so far, but the strong and rapidly improving fundamentals of the company didn't let that happen, and recent technical action in the stock suggests that it is consolidating here ahead of another strong runand once it gets above this resistance it will be in position for a really big move and the scenario where the deep drill strikes it rich and the stock skyrockets is very much "on the table" technically.
The conclusion is that Tanzanian Royalty is a very strong buy here and therefore, of course, we stay long, and it is considered to be in order to add to positions and go overweight on this one. The cherry on the cake is that it is currently near to the bottom of the consolidation pattern and so at an excellent entry point.
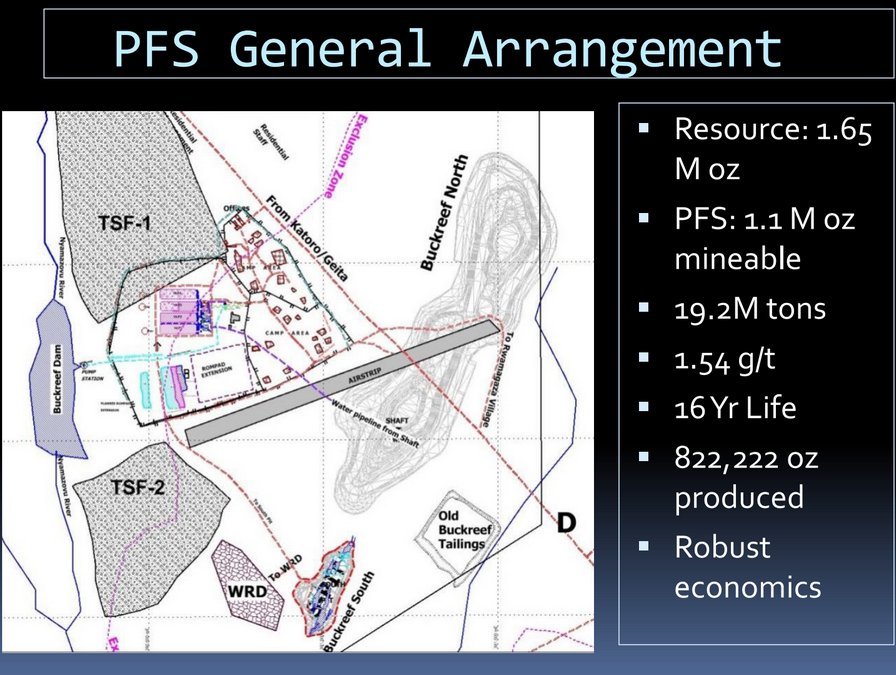
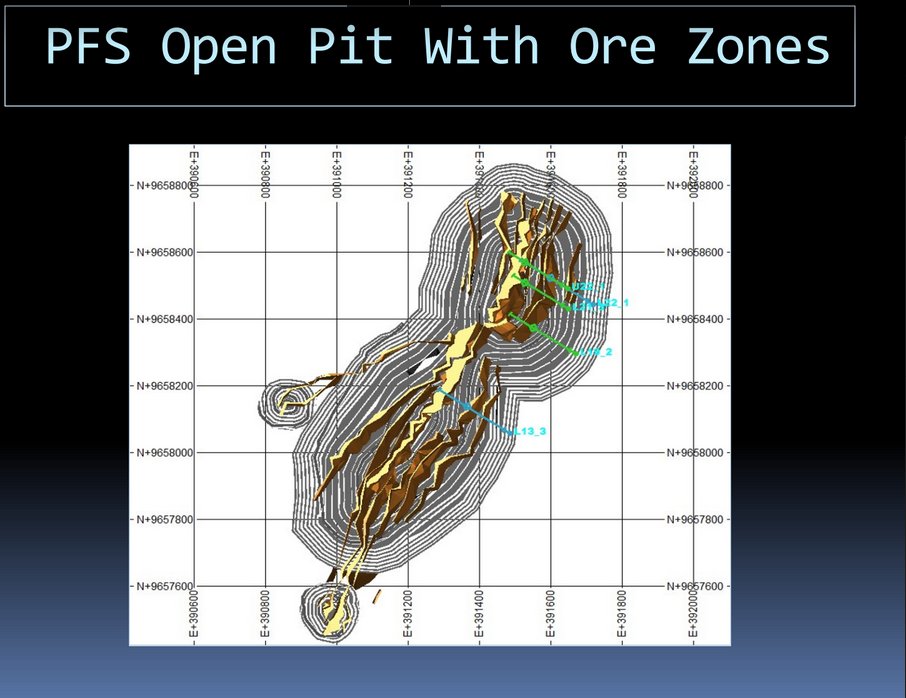
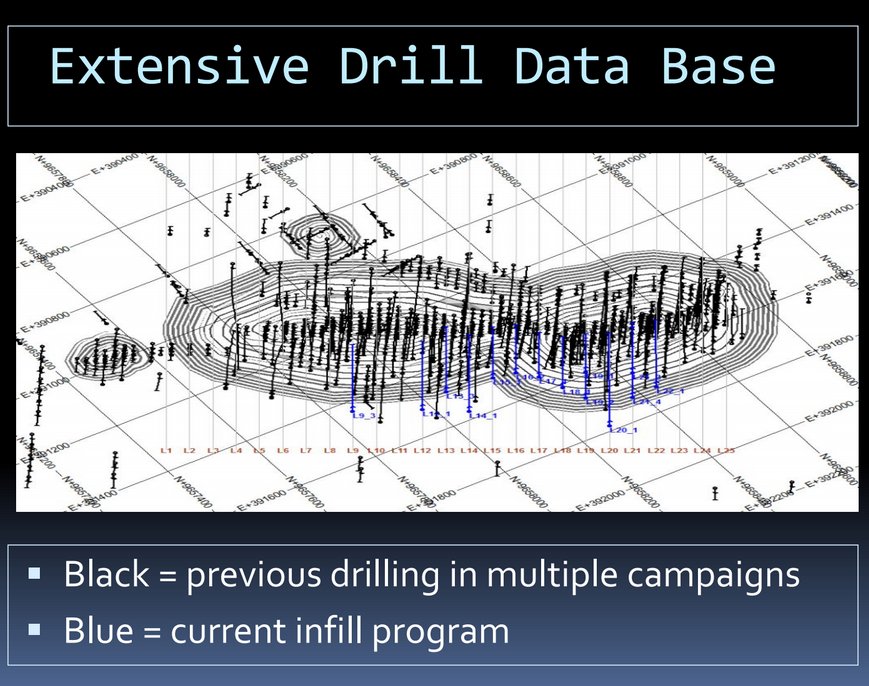
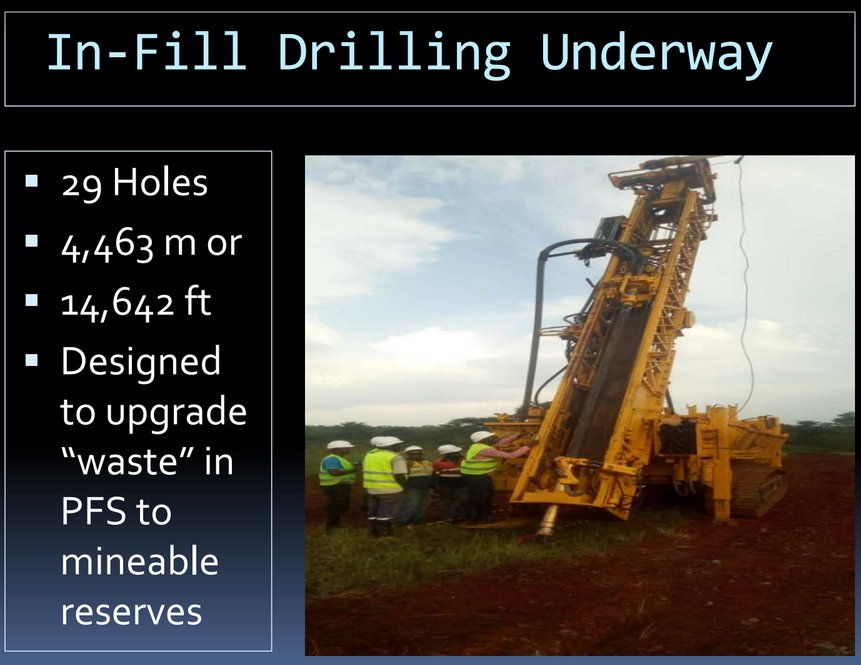
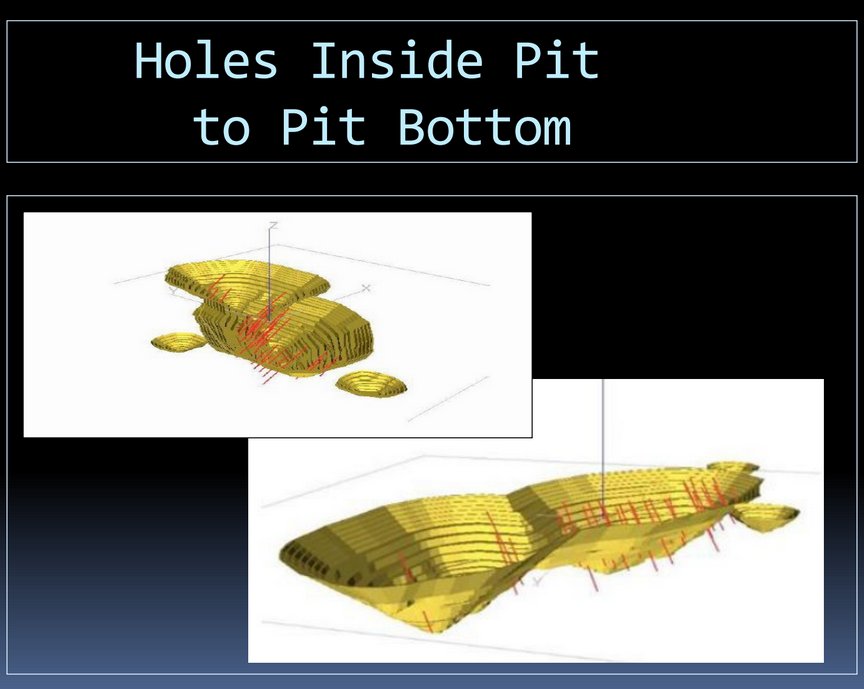
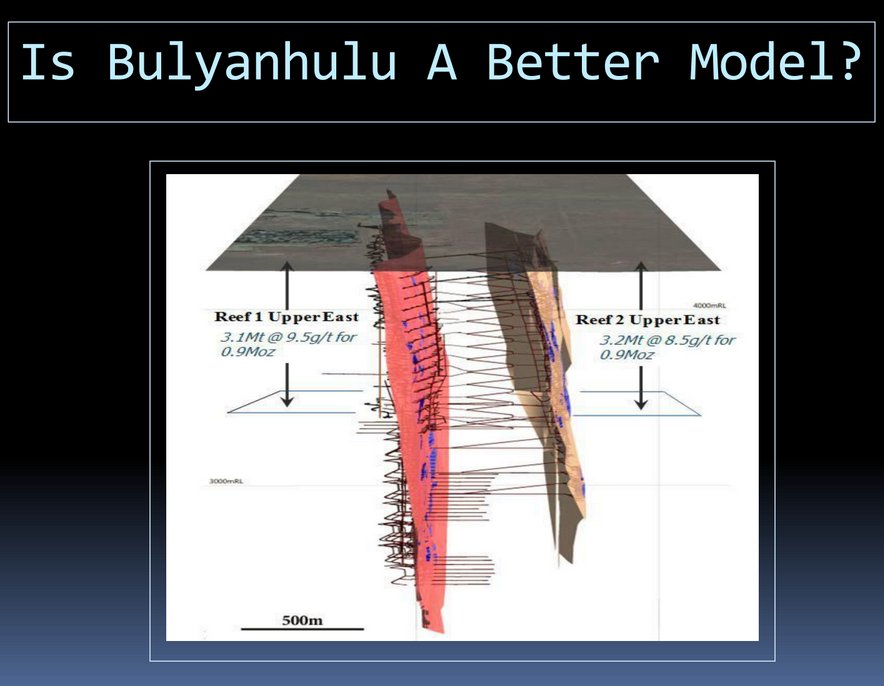
It is worth viewing the company's recent presentation at the Toronto Marriott given by Jim Sinclair and Ulrich Rath, which may be accessed either on the Tanzanian Royalty homepage or on JSMineset where it was posted on 14th March. The following pictures from the presentation have been added to this article later on the 21st. Note that clicking on each picture will popup a larger and possibly clearer version.
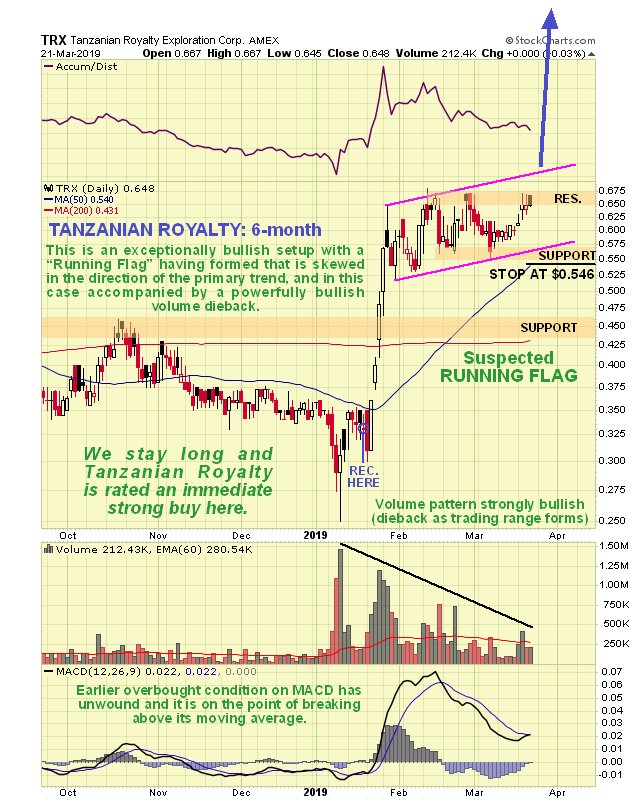
The following 6-month chart for the stock is an updated version of the one shown above. On it we see that we appear to have caught another low within the trading range about a week ago, as it has since risen up close to the breakout line which is at about 68 cents, and it is believed to be well positioned for the next upleg, as we see that the earlier overbought condition (MACD) has unwound with the MACD on the point of crossing its moving average, the 50-day moving average has largely closed the gap with the price, and this at a time when the Fed has publicly withdrawn support for the dollar by stating that it won't raise rates again this year, a stance which is likely to spark a gold breakout above $1,400 before long, that needless to say will drive the better gold stocks like this much higher.
Tanzanian Royalty website.
Tanzanian Royalty Exploration Corporation, TRX, TNX.TSX, closed at $0.59, C$0.76 on 15th March 2019.
Posted originally at 11.00 am EDT on 17th March 2019 on CliveMaund.com. Slides and updated charts added later.
Clive Maund has been president of www.clivemaund.com, a successful resource sector website, since its inception in 2003. He has 30 years' experience in technical analysis and has worked for banks, commodity brokers and stockbrokers in the City of London. He holds a Diploma in Technical Analysis from the UK Society of Technical Analysts.
[NLINSERT]Disclosure:
1) Clive Maund: I, or members of my immediate household or family, own shares of the following companies mentioned in this article: None. I personally am, or members of my immediate household or family are, paid by the following companies mentioned in this article: None. My company has a financial relationship with the following companies mentioned in this article: None. CliveMaund.com disclosures below. I determined which companies would be included in this article based on my research and understanding of the sector.
2) The following companies mentioned in this article are billboard sponsors of Streetwise Reports: MAG Silver. Click here for important disclosures about sponsor fees.
3) Statements and opinions expressed are the opinions of the author and not of Streetwise Reports or its officers. The author is wholly responsible for the validity of the statements. The author was not paid by Streetwise Reports for this article. Streetwise Reports was not paid by the author to publish or syndicate this article. The information provided above is for informational purposes only and is not a recommendation to buy or sell any security. Streetwise Reports requires contributing authors to disclose any shareholdings in, or economic relationships with, companies that they write about. Streetwise Reports relies upon the authors to accurately provide this information and Streetwise Reports has no means of verifying its accuracy.
4) This article does not constitute investment advice. Each reader is encouraged to consult with his or her individual financial professional and any action a reader takes as a result of information presented here is his or her own responsibility. By opening this page, each reader accepts and agrees to Streetwise Reports' terms of use and full legal disclaimer. This article is not a solicitation for investment. Streetwise Reports does not render general or specific investment advice and the information on Streetwise Reports should not be considered a recommendation to buy or sell any security. Streetwise Reports does not endorse or recommend the business, products, services or securities of any company mentioned on Streetwise Reports.
5) From time to time, Streetwise Reports LLC and its directors, officers, employees or members of their families, as well as persons interviewed for articles and interviews on the site, may have a long or short position in securities mentioned. Directors, officers, employees or members of their immediate families are prohibited from making purchases and/or sales of those securities in the open market or otherwise from the time of the interview or the decision to write an article until three business days after the publication of the interview or article. The foregoing prohibition does not apply to articles that in substance only restate previously published company releases.
Charts provided by the author.
CliveMaund.com Disclosure:
The above represents the opinion and analysis of Mr Maund, based on data available to him, at the time of writing. Mr. Maund's opinions are his own, and are not a recommendation or an offer to buy or sell securities. Mr. Maund is an independent analyst who receives no compensation of any kind from any groups, individuals or corporations mentioned in his reports. As trading and investing in any financial markets may involve serious risk of loss, Mr. Maund recommends that you consult with a qualified investment advisor, one licensed by appropriate regulatory agencies in your legal jurisdiction and do your own due diligence and research when making any kind of a transaction with financial ramifications. Although a qualified and experienced stock market analyst, Clive Maund is not a Registered Securities Advisor. Therefore Mr. Maund's opinions on the market and stocks can only be construed as a solicitation to buy and sell securities when they are subject to the prior approval and endorsement of a Registered Securities Advisor operating in accordance with the appropriate regulations in your area of jurisdiction.


